Selected Works Gallery
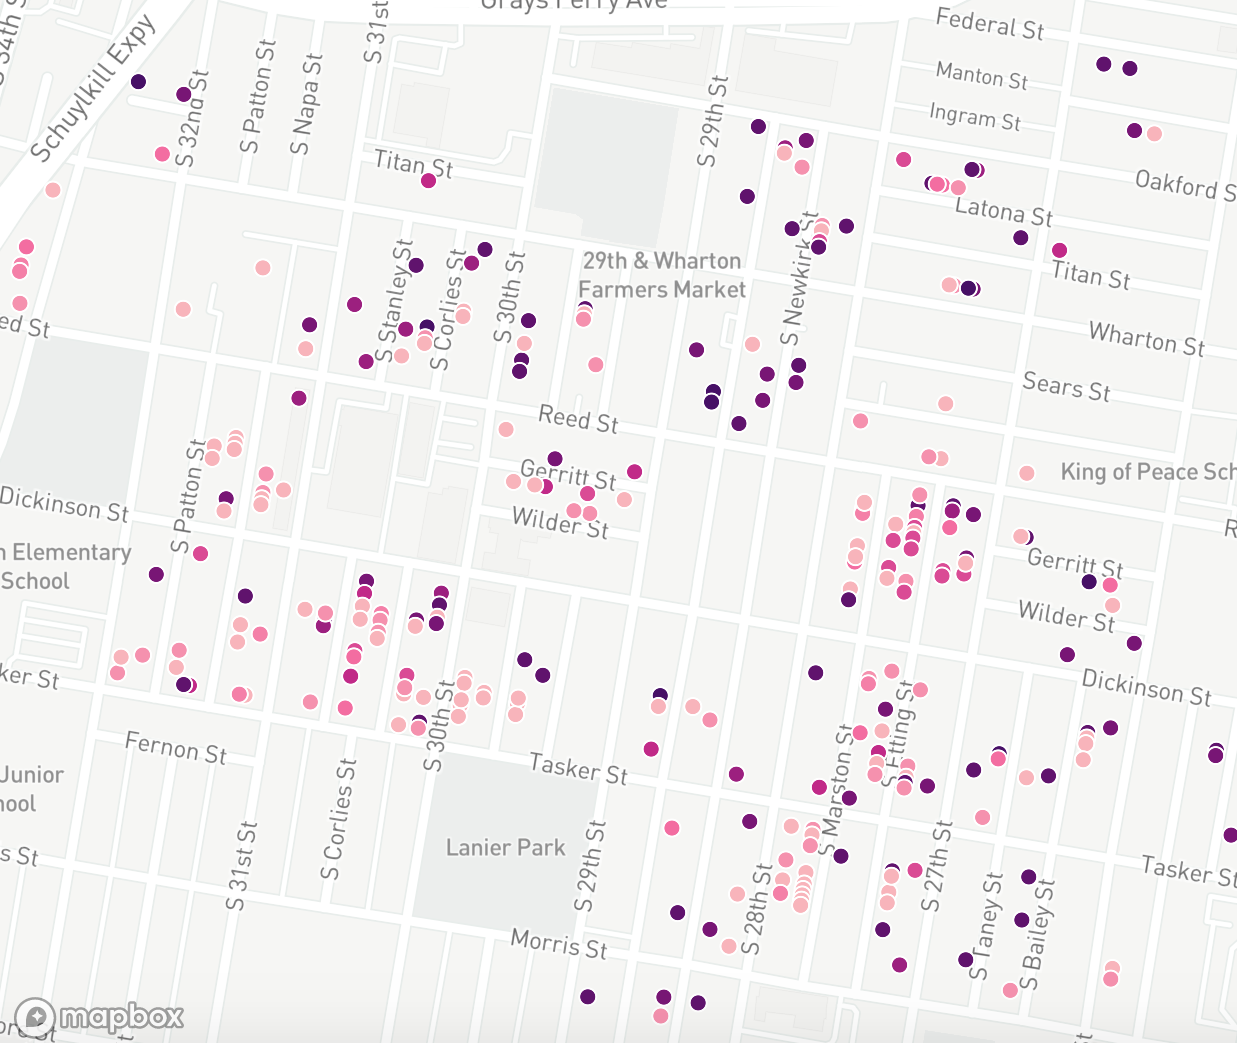
Illegal Rentals in Philadelphia
Illegal rentals lead to illegal evictions, which contribute to homelessness. This machine learning algorithm predicts the likelihood of illegal rentals in Philadelphia, so the city can more efficiently allocate their limited resources for housing inspections. Other cities faced with the same challenge can refer to this Markdown document to replicate the code and adjust to their needs.
Software used: R, ArcGIS, JavaScript, HTML, CSS
NYC Picks: Taxi vs Uber
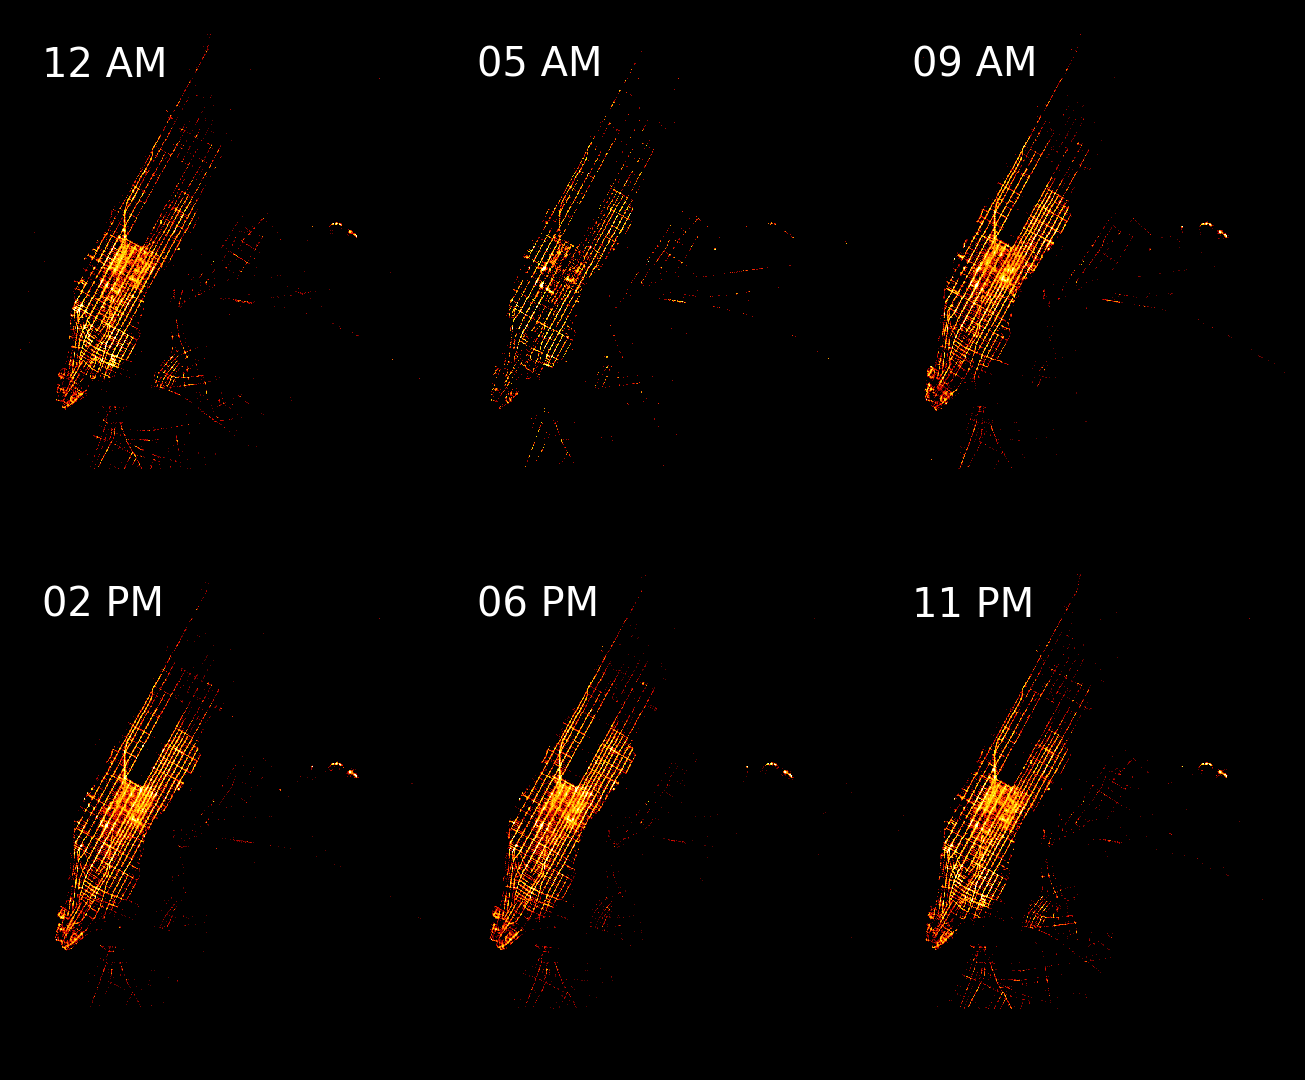
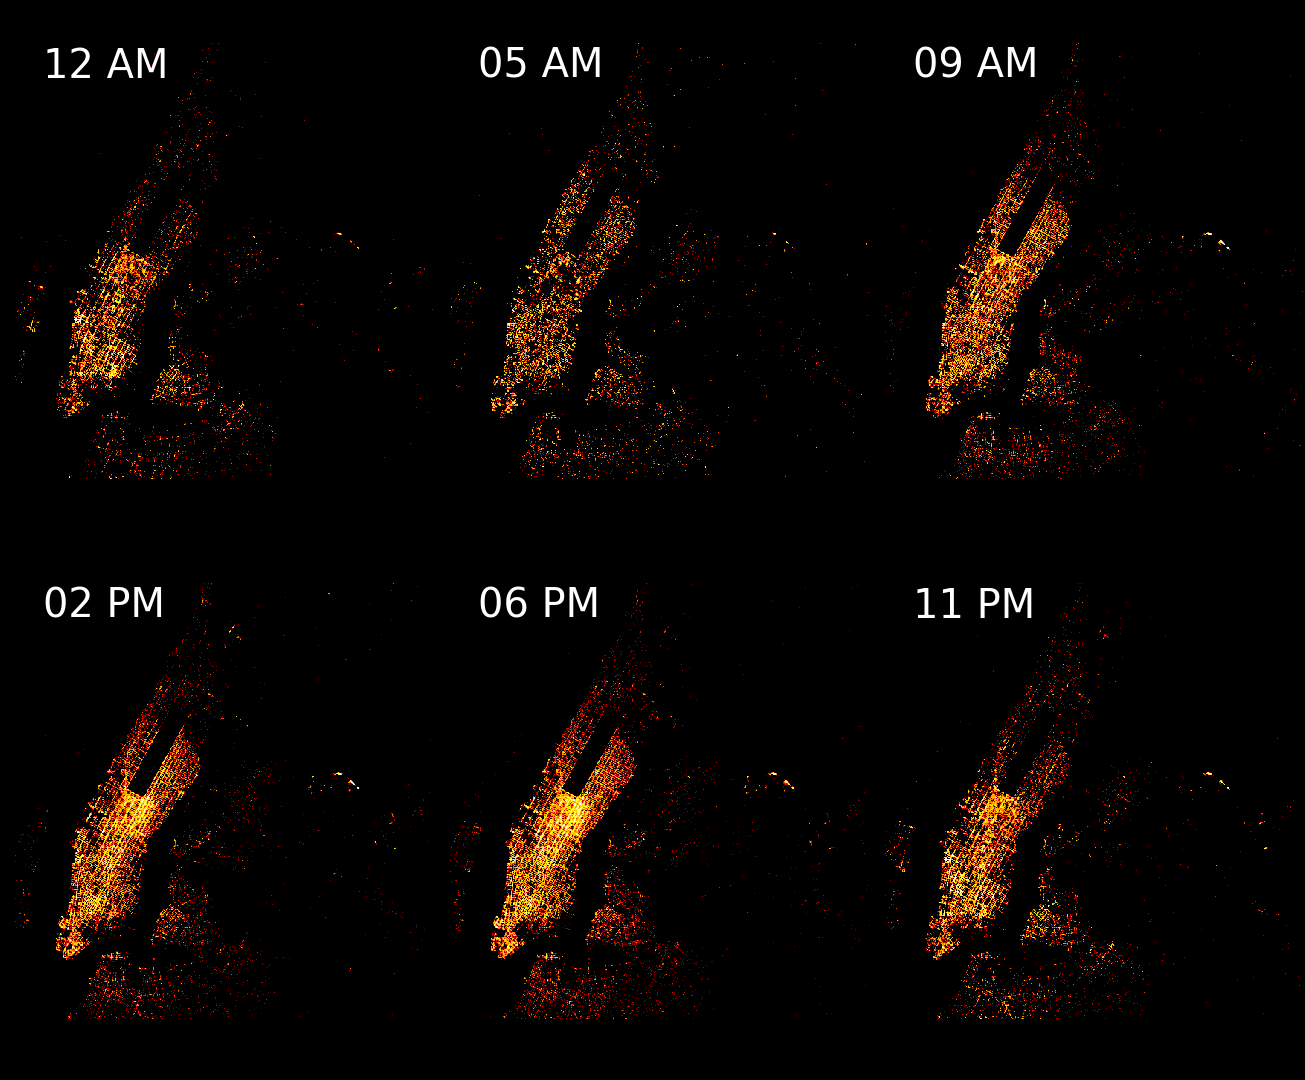
Increased usage of rideshare apps in recent years has raised discussion on their competition against the taxicab industry. This analysis compares and contrasts the popularity of Taxi and Uber in 2014 in terms of passenger pickups. It further studies the implications of the patterns in the data, based on monthly, hourly and geospatial trends.
Jupyter Notebook Code
Software used: Python, HTML
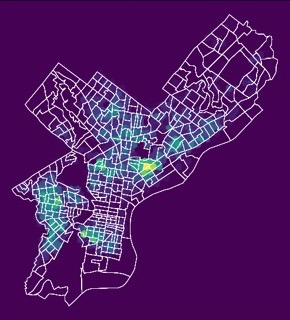
Spatial Trends of Evictions
Study of spatial correlations between eviction cases and code violations in Philadelphia, with the intention to offer some insight into the idea that evictions occur as a retaliation against renters for reporting code violations
Software used: Python (Libraries: (geo)pandas, numpy, matplotlib, cartopy.crs, hvplot, holoviews, carto.sql, seaborn, altair)
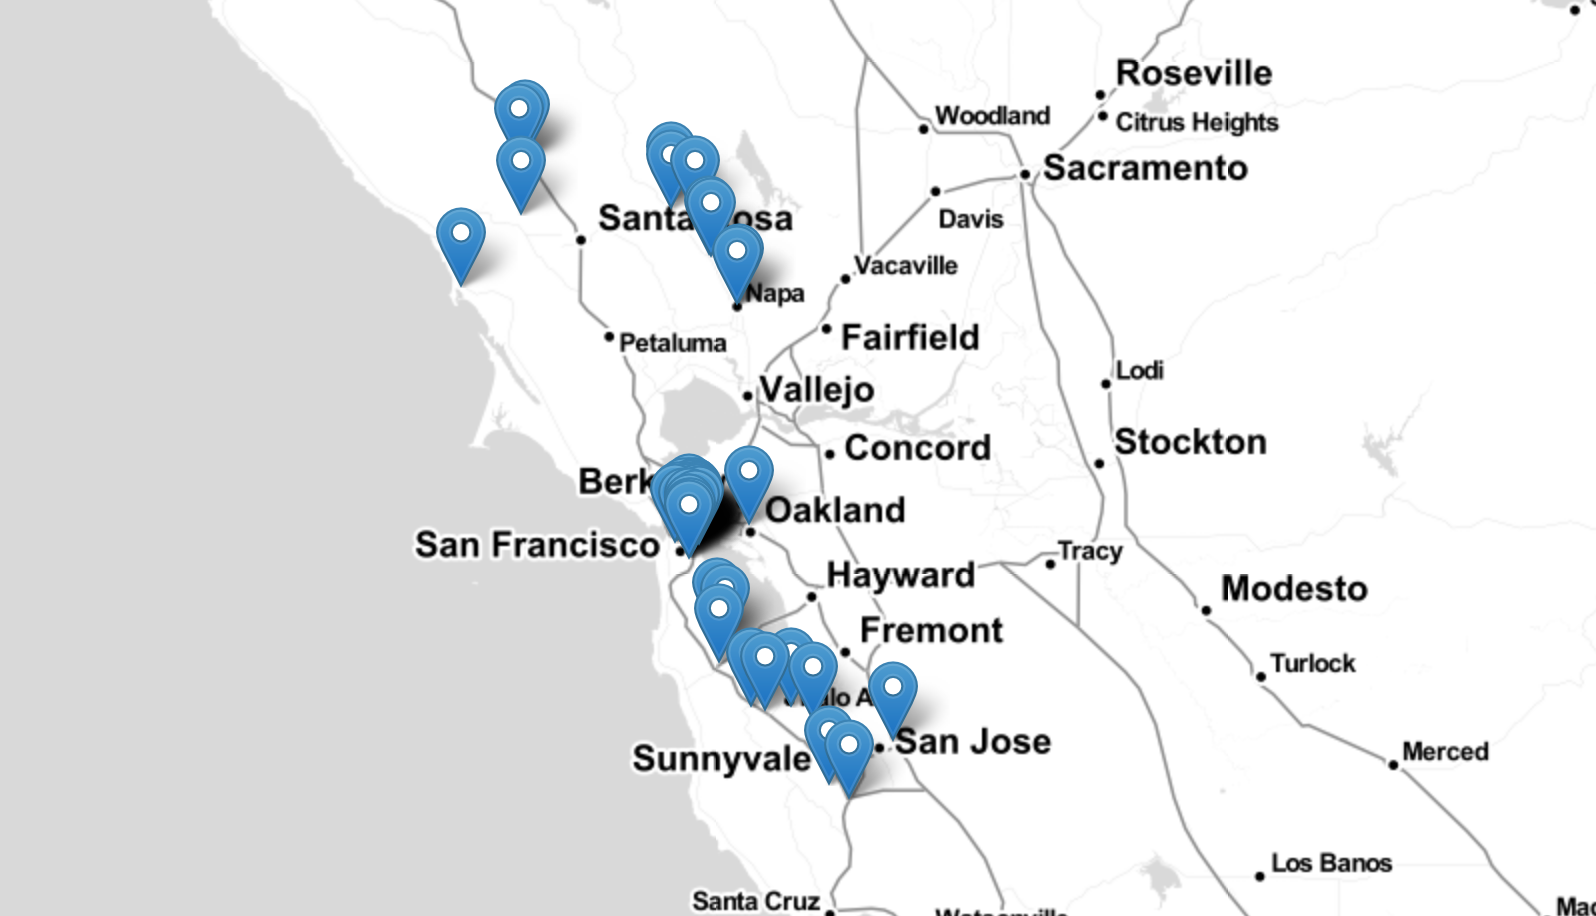
Exploring San Francisco
Story map application of San Francisco's neighborhoods, Michelin Star restaurants and Privately-Owned-Public-Spaces (POPOS). Thorough application of coding functions, requesting ajax calls, styling web pages and incorporating user interactivity. Visual representations of processed json datasets displayed on a series of slides primarily using the Leaflet library.
Software used: HTML, CSS, JavaScript
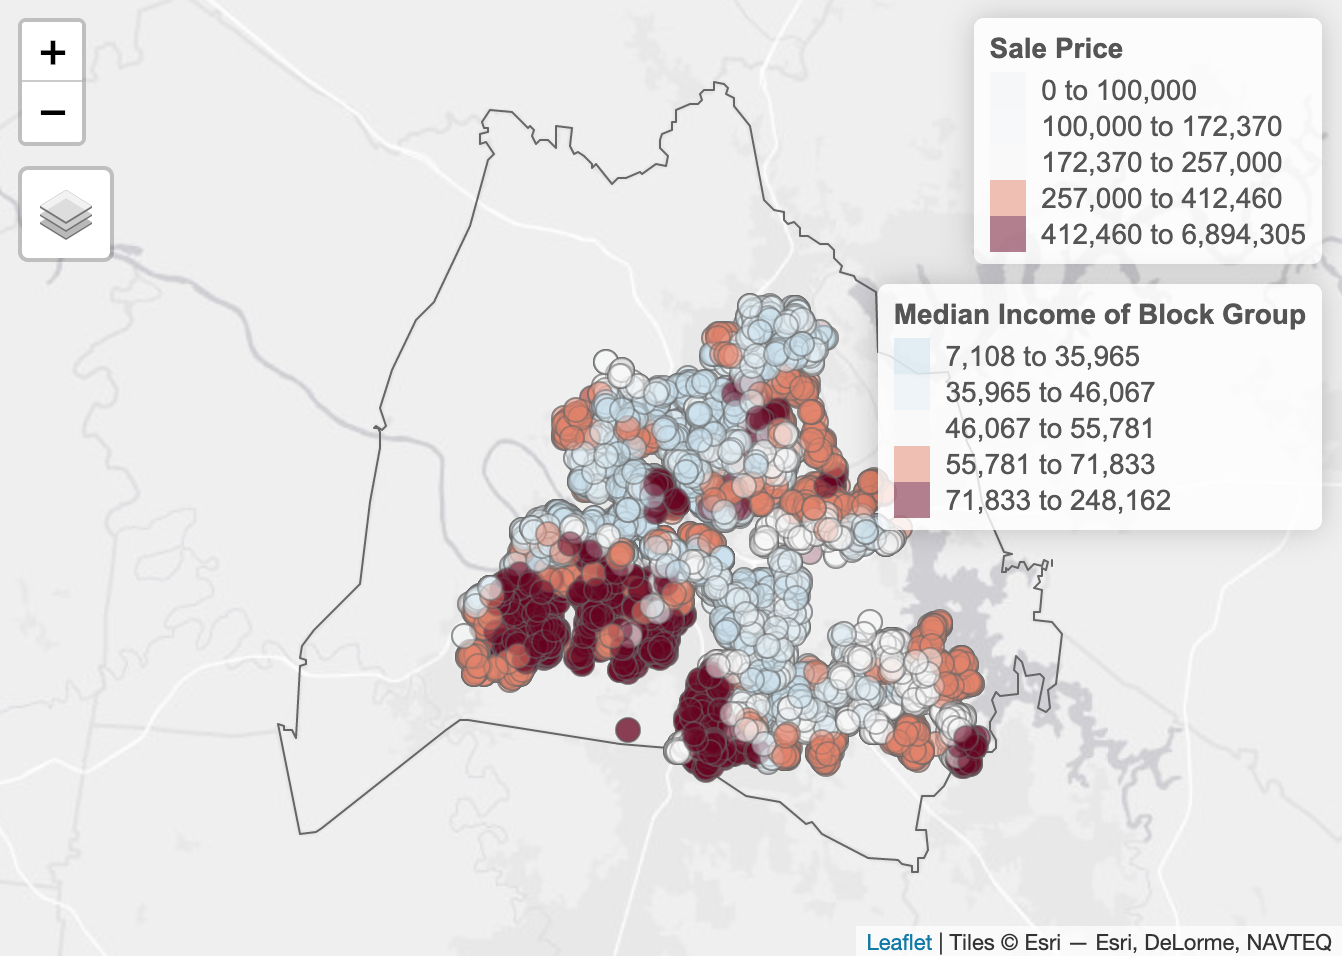
Nashville Home Price Predictions
Predictive model of home price predictions in Nashville using data from Zillow, intended to help planners appropriately accommodate the growing population with affordable home prices. Used Mean Absolute Error (MAE) and Mean Absolute Percentage Error (MAPE) diagnostics for cross-validated training and in-sample tests.
Software used: R
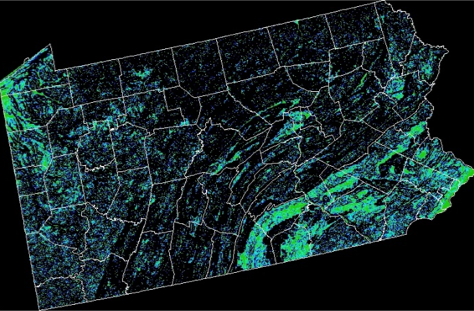
Urban Growth vs Development Suitability
Evaluation of threat and opportunity areas with respect to future urbanization - where are areas “sensitive” to development but where development may be infringing upon in the coming years?; where are areas not environmentally sensitive to development where development will likely be encouraged in future years?
Software used: ESRI ArcGIS
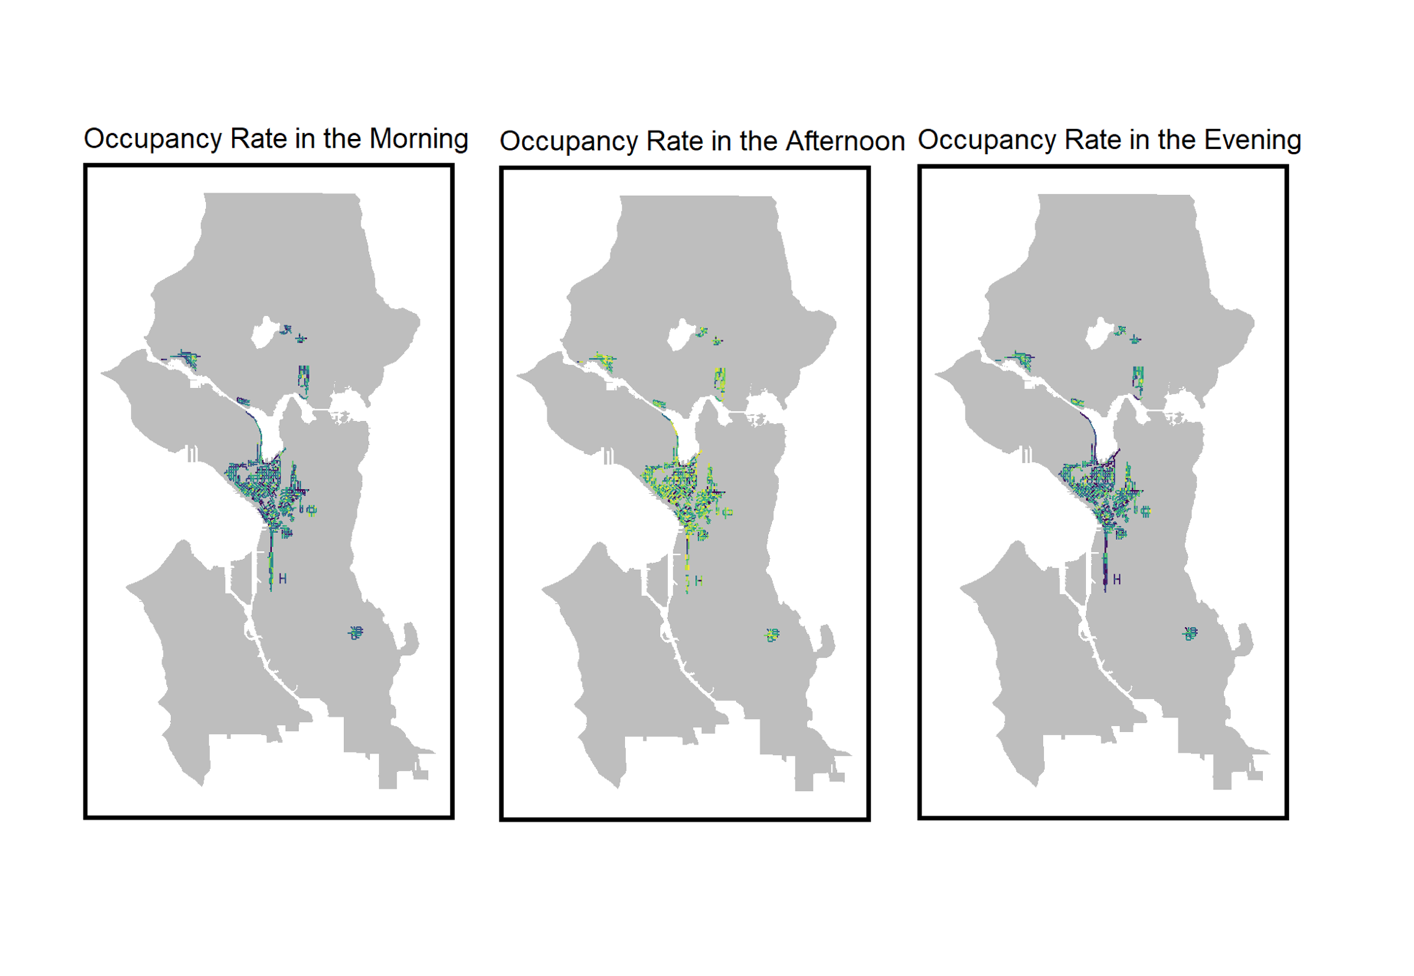
Seattle Street Parking Demand
Predictive model of street parking demand in Seattle, with the intent to help planners understand how planning decisions - such as a neighborhood zoning code change - affect street parking demand in the city. Study of observed and predicted spatial and temporal demands for street parking.
Software used: R, ESRI ArcGIS
Willingness to Pay for Transit
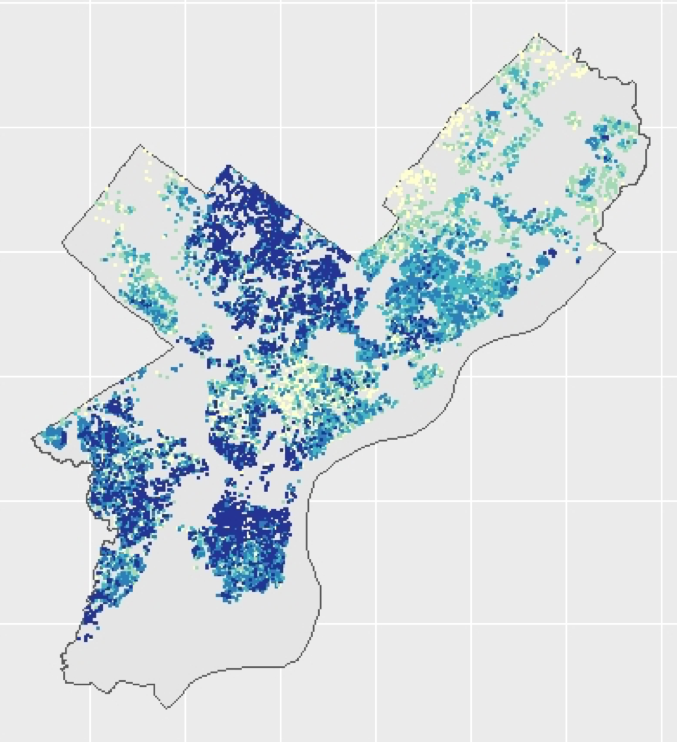
Study of home prices in relation to Transit Oriented Development (TOD) in Philadelphia. A "kitchen-sink" model tries to identify the transit price premium by controlling for neighborhood factors and the second part develops a quasi-experimental design attempts to better identify the willingness to pay.
Software used: R
Remote Sensing & Land Use Efficiency
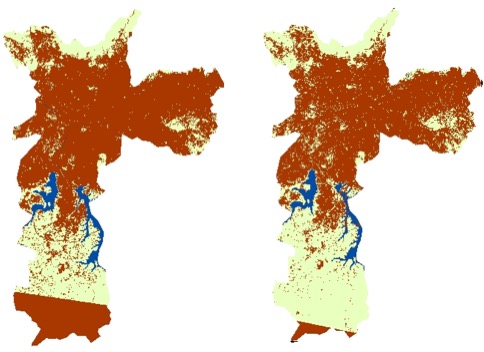
Study of how the city of Sao Paulo, Brazil has sprawled over time relative to its population growth. LANDSAT imagery used to create a normalized difference vegetation index (NDVI) and supervised classification further implemented to classify land cover types. Change over time calculated using a land use efficiency ratio.
Software used: ESRI ArcGIS
California Wildfires Risk Zone Analysis
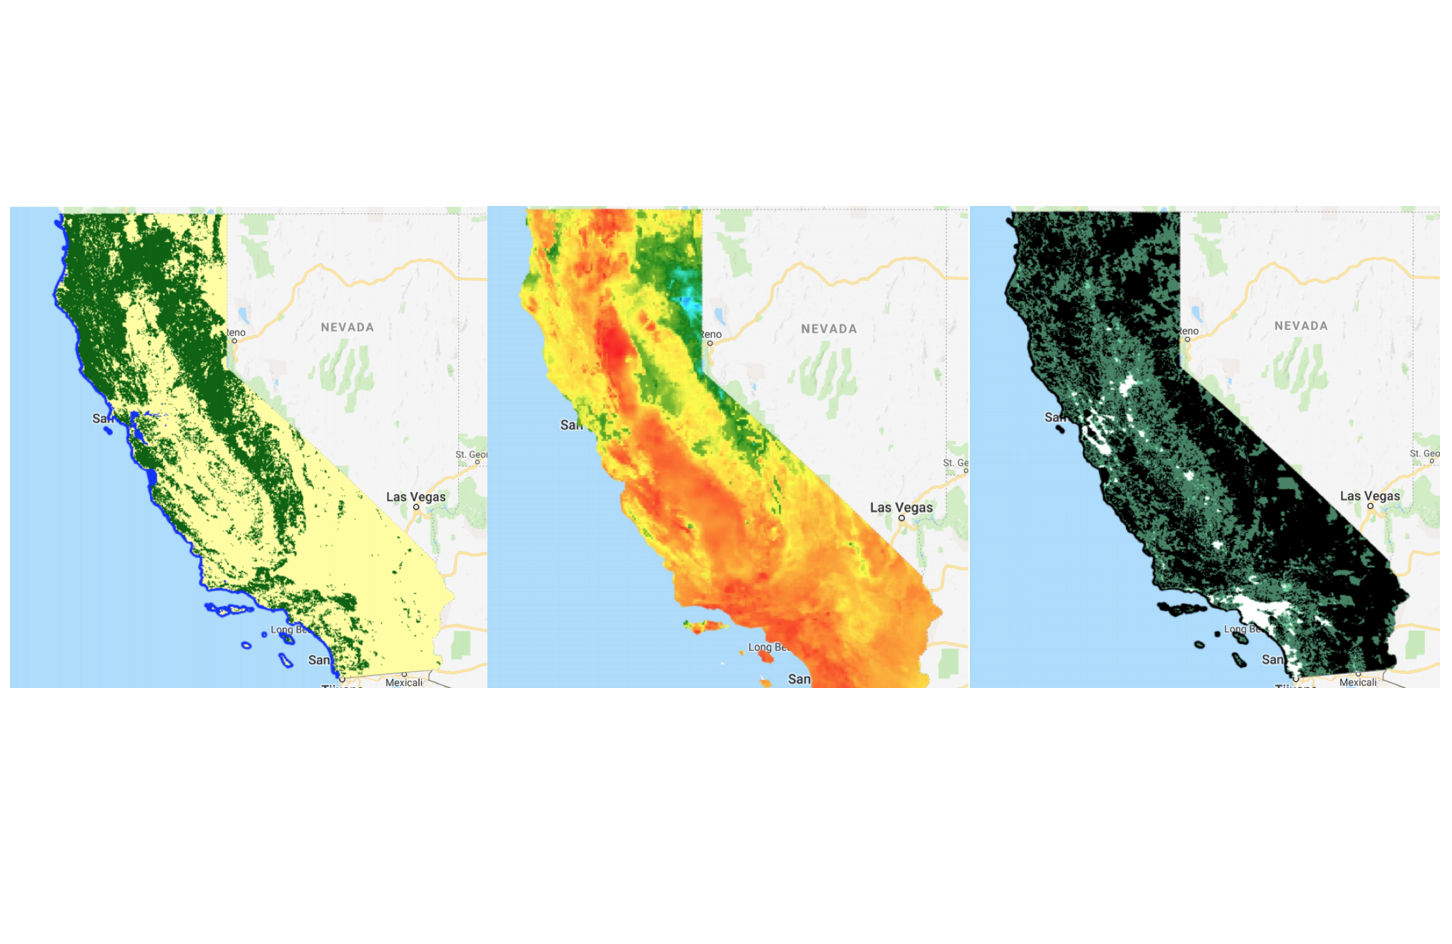
Processed satellite imagery of annual wildfires in California. Using geographic features like vegetation, drought, humidity, elevation and wind speeds, sensitivity and risk maps were created, which serves to suggest first responders the areas of greater priority in the event of a wildfire.
Software used: JavaScript, Google Earth Engine
Shootings in Philadelphia
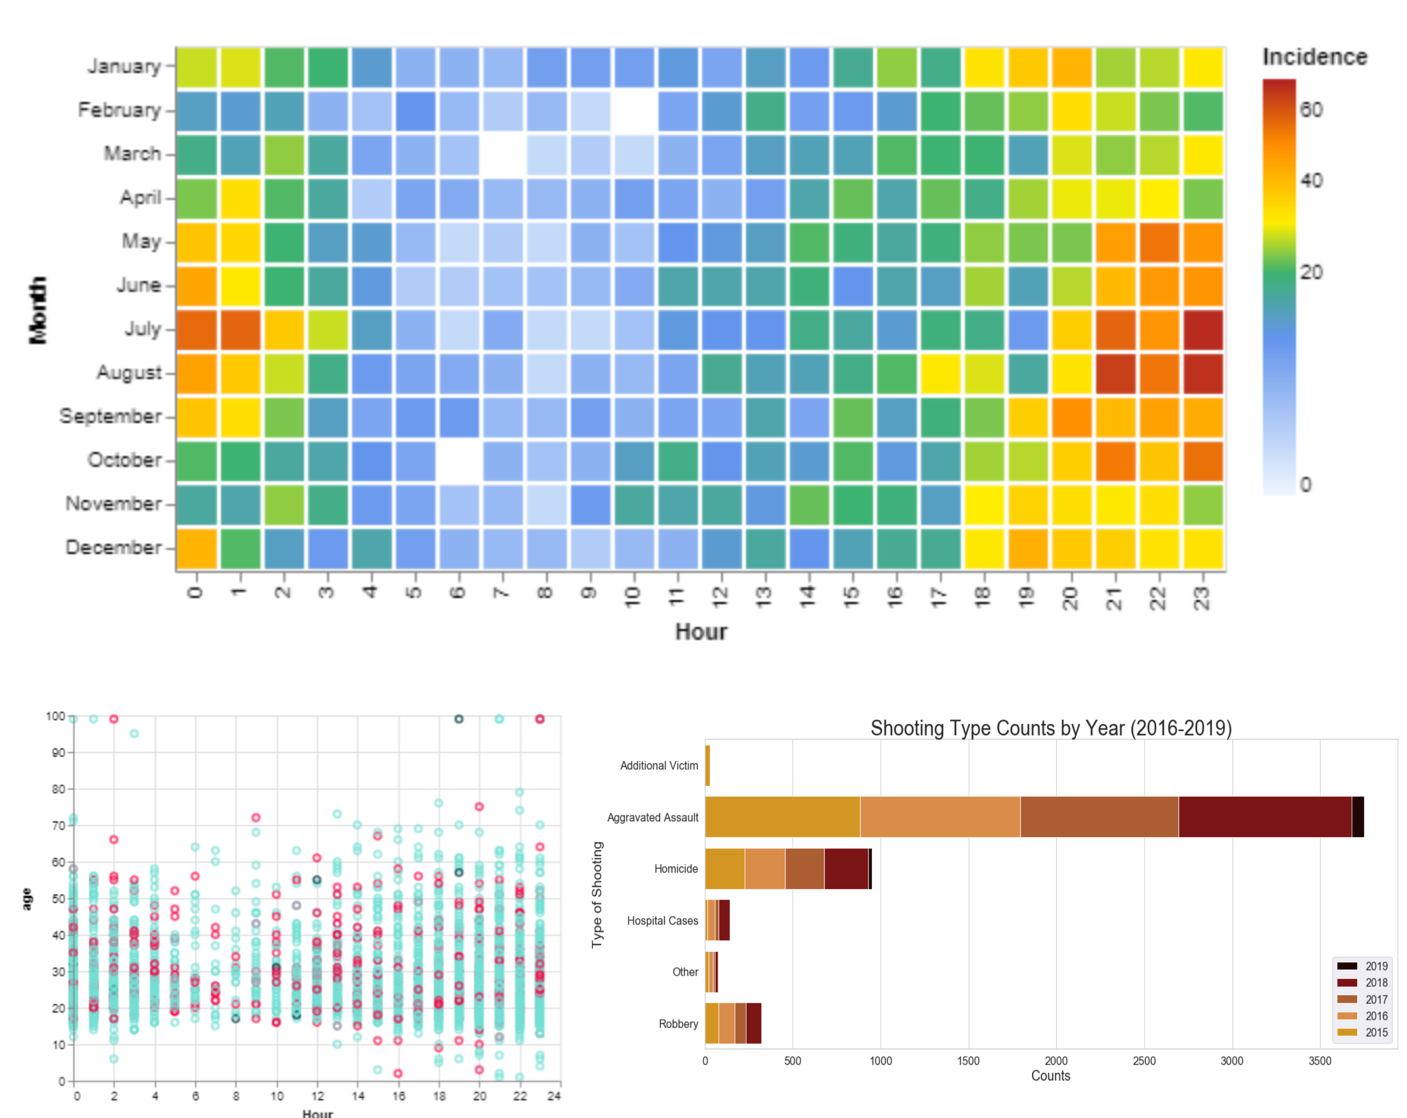
Data manipulation using shootings data in Philadelphia. Creation of static and interactive visualizations to explore the distribution and trends from the dataset.
Software used: Python ((Geo)Pandas, Numpy, Matplotlib, Seaborn, Json, Altair)
About Me
Education
University of Pennsylvania | May 2019
M.S. Urban Spatial Analytics
University of California, Berkeley | May 2018
B.A. Sustainable Environmental Design
Minor Geospatial Information Science and Technology
Technical Skills
Programming
- Python, SQL, JavaScript, R, HTML, CSS, jQuery
Libraries
- (Geo)Pandas, NumPy, CartoPy, Hvplot, Carto.sql, Matplotlib, Altair, Seaborn, Json, Leaflet
Cartography
- ESRI ArcGIS, QGIS, CARTO, Social Explorer, Google Earth Engine
Design
- Adobe Photoshop, Adobe InDesign, Adobe Illustrator, SketchUp, Drupal
Languages
- Native speaker of Portuguese and Korean
Contact Me
angelica.hskim@berkeley.edu
San Jose, CA